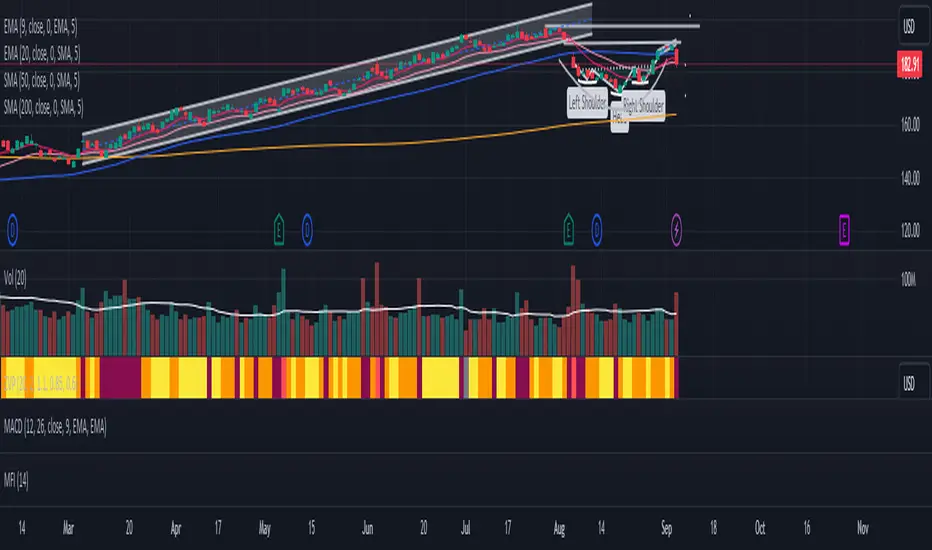
Zanger Volume Profile ZVR v1This is an attempt to make a zanger volume profile indicator, it needs improvement and some sort of forward looking volume estimator. Wskaźnik Pine Script®od krsnead21161
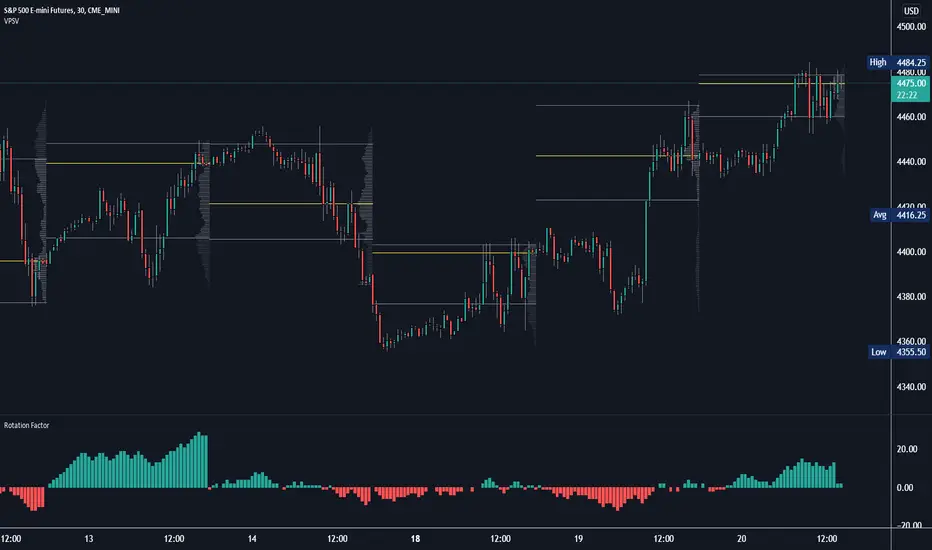
Rotation Factor: Buy/Sell Pressure for Market/Volume ProfileRotation Factor is a simple formula to figure out the buy and sell pressure of the overall day. Rotation Factor is usually combined with Market Profile or Volume Profile analysis. It is designed to be used on the 30min timeframe with a 1D interval reset. It can be used on other timeframes, but results will vary. Some Rotation Factor traders like to use it on a daily with a 1M interval reset for longer term trading. The formula is very clean because it only focuses on price action, highs and lows. The formula is as follows: Current Bar makes Higher High and Higher Low +2 points Current Bar makes Lower High and Lower Low -2 Points Current Bar makes Higher High and Lower Low 0 Points Current Bar makes Lower High and Higher Low 0 Points Current High and Previous High are Equal and Higher Low +1 Points Current Bar makes Higher High but Current and Previous lows are equal +1 Points Current Bar makes Lower High but Current and Previous lows are equal -1 Points Current High and Previous High are Equal and Lower Low -1 Points I hope you enjoy this indicator, if you have any questions let me know in the comments.Wskaźnik Pine Script®od OasisTradingZaktualizowano 1010957
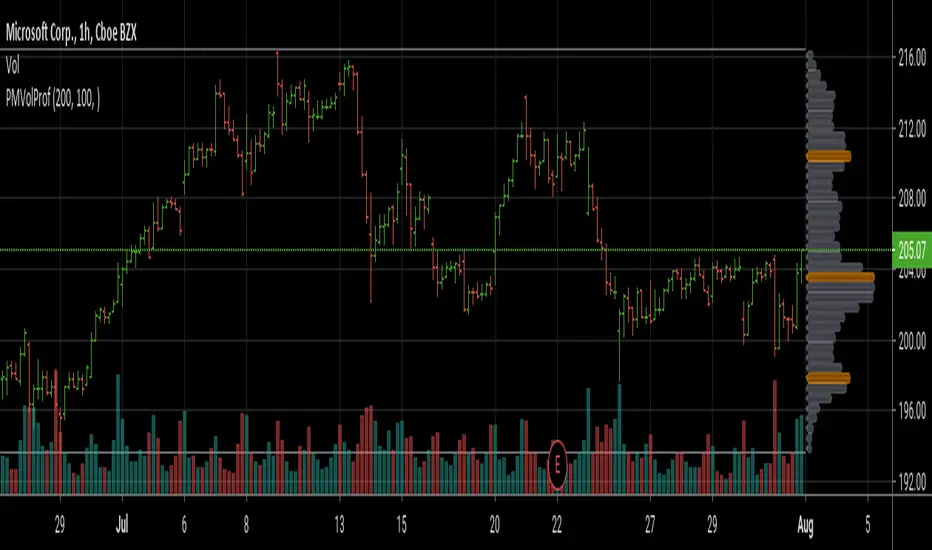
Poor man's volume profileThis is an attempt to get something more or less similar to the volume profile for free. The code is generated using a template. To change the settings, you may need to regenerate the code. The code has a link to the repository with the template.Wskaźnik Pine Script®od IldarAkhmetgaleevZaktualizowano 5454 4.7 K
Ori Volume Profile (Limited)Ori Volume Profile plots trading volume as a histogram on the price scale. The purpose of this script is to show potential of pine scripts. Parameters set with default values on this script and can't be changed since it is limited version. Default numbers for this script is last 500 bars for calculating and 25 rows for drawing histogram. Wskaźnik Pine Script®od dr.orientemZaktualizowano 99676
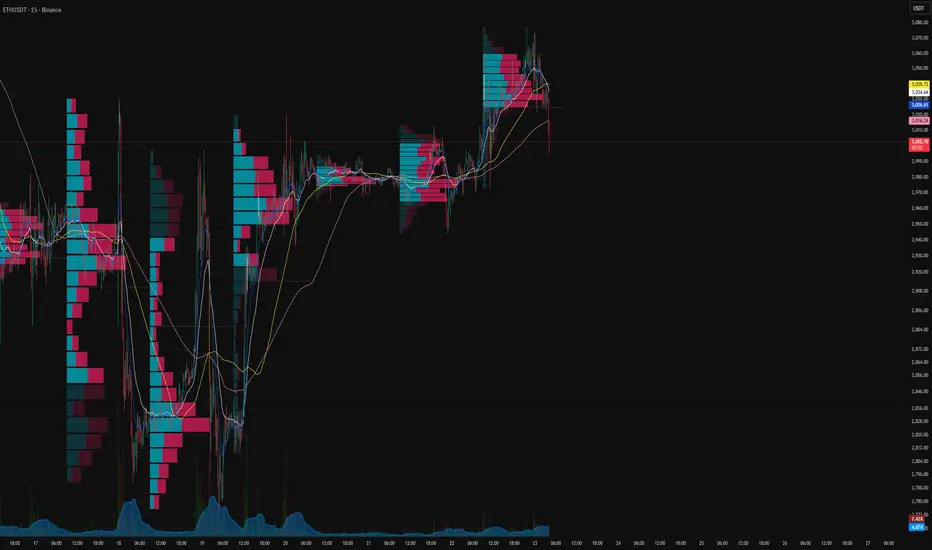
Dynamic Volume ProfileThe result of standard volume profile is fix for a specified period of time. However, in this script the result is dynamic, because its calculated for every bar. In this script you can see the change of Point of Control , Value Area High and Value Area Low in real time. Point of Control is the price level for the time period with the highest traded volume. The area between value area low and value area high (green background) is the area where 70% of traded volume happen. You can customize this percentage value in input section. Trader can customize input: Period length Number of rows Percentage of value area Reference: www.tradingview.comWskaźnik Pine Script®od flintlockwoodZaktualizowano 3535 7.3 K
MTF Volume Profile & Signal Scanner v5The MTF Signal Scanner is a multi-timeframe trading system designed for futures trading, particularly optimized for MNQ (Micro E-mini Nasdaq-100). It combines volume profile analysis, EMA trend filtering, and a confluence scoring system to identify high-probability trade setups.Wskaźnik Pine Script®od zackzackzackw97
Multi-Timeframe Volume ProfileThe script has the volume profile VAH, VAL and POC for the previous week, overnight session, previous day and the current session.Wskaźnik Pine Script®od mariotvrdeich3
Daily Volume ProfileThis indicator is identical to the Fixed Range Volume Profile, except that it automatically fixes the range to a daily basis.Wskaźnik Pine Script®od luka11037Zaktualizowano 2258
(SM3) Volume Profile Tool-kit1st pine script. It is a work in progress. I use this to mark previous day high and low value areas as well as overnight volume profile for NYSE open strategy.Wskaźnik Pine Script®od lesley0128Zaktualizowano 85
Session Volume Profile-1This indicator used to show volume profile, you can not change the code. You can suggest the changesWskaźnik Pine Script®od Astatrading0315
Volume Profile: Intra-bar VolumeThis indicator was developed as part of a free blog post tutorial on the Backtest-Rookies website for detailed code commentary, head over there. Scope The indicator shall attempt to do the following: Look at a lower time-frame. E.g 5 minutes when on a 1-hour chart. Create a function to loop through through candles and make an assessment. If the candle it closed up, the volume will be categorized as buying volume. Conversely, if it closed down, the volume will be categorized as selling volume The function will then be passed to the security() function to run on a lower timeframe. All buying volume and selling volume from the lower time-frame shall be summed and displayed on the main chart. Important Note This indicator will not give you genuine buying or selling volume. It simply follows the assumption that if price closed up, there must have been more buyers than sellers and if it closed down we assume the opposite. Usage In order to use this indicator, users will need to calculate how many lower time-frame bars are contained in the time-frame on the main chart. So for example, the default settings are configured for the indicator to be run on the 1H chart. As a result, we need to set the "Bars on Lower Timeframe" input to 12. This is because there are 12 x 5-minute bars in 60 minutes. Wskaźnik Pine Script®od BacktestRookies1111 2.2 K
Volume Profile: Date-Range ObservationI have refined the strategy developed by kv4coins , incorporating an additional option for the observation date range. Previously, when seeking a fixed date range—particularly to track data from the onset of an event-driven trigger up to the present—it was somewhat cumbersome. To address this, I added a new date selection feature to accommodate the need for observing specific time periods.Wskaźnik Pine Script®od cinderrazorZaktualizowano 26
VP-Period with Previous Day Levels & Historical POC# Volume Profile with Previous Day Levels & Historical POCs ## Description Comprehensive indicator combining Volume Profile analysis, previous day levels, and historical POC (Point of Control) levels for advanced technical analysis. ## Key Features ### Volume Profile - **Customizable period**: 3 to 500 days - **Calculation resolution**: 400 to 700 points - **Current VPOC**: Point of Control line for current period - **Volume bars**: graphical display of volume profile distribution ### Historical POCs - **POC history**: up to 20 previous days - **Time labels**: shows how many days ago for each POC - **Dashed lines**: easy identification of historical levels ### Previous Day Levels (last 5 days) - **High/Low**: daily highs and lows - **Midpoint**: 50% level (High+Low)/2 - **Open/Close**: opening and closing prices - **Progressive thickness**: day 1 thicker, decreasing for previous days ## Customization - Fully configurable colors for each element - Toggle on/off switches for every component - Different line styles (solid, dashed, dotted) ## Usage Perfect for traders using volume analysis and support/resistance based on previous daily levels. Ideal for identifying key zones and significant breakout points.Wskaźnik Pine Script®od alessia1973fZaktualizowano 4488
Volume Profile + Price Action Strategy (POC-based)This indicator combines volume dynamics, price action patterns, and a simplified Point of Control (POC) to highlight potential high-probability trade zones. 🔍 Key Features POC-Based Logic Plots the POC from the most recent closed 10-minute candle as a horizontal level for intraday structure. Volume Spike Detection Highlights unusual activity based on volume compared to the average of the last N candles. Effort vs. Result Analysis Based on Wyckoff-inspired logic: Absorption: Large volume, small body → possible buyer/seller absorption False Move: Small volume, large body → potential fakeout Price Action Recognition Detects: Inside Bars Pin Bars Engulfing Candles Signal Highlights 🔺 Absorption Signals (below bar, teal triangle) 🔻 False Move Signals (above bar, orange triangle) 🔷 POC Line ⚙️ Customizable Inputs You can control signal sensitivity with these inputs: Volume Spike Multiplier Raise to filter only extreme volume spikes → Recommended: 2.0 to 3.0 for cleaner setups Absorption Body Ratio Lower to detect only very small bodies (tight candles) → Try 0.3 to 0.4 for stricter absorption logic False Move Body Ratio Raise to catch only large candles on low volume → Use 2.0+ to filter weak moves 🧠 How to Use Use in confluence with: Support/Resistance VWAP or moving averages Session opens/closes Best on 10-minute charts, but adjustable ✅ Signal Tuning Tips Want fewer but cleaner signals? Increase Volume Spike Multiplier: 2.5+ Decrease Absorption Body Ratio: 0.3 Increase False Move Ratio: 2.0+ Want more frequent signals? Lower Volume Multiplier: 1.2–1.5 Raise Absorption Ratio: 0.6+ Lower False Move Ratio: 1.2–1.4 📊 Recommended Timeframe Optimized for 10-minute charts Works intraday, especially around session opens and POC re-tests ⚠️ Disclaimer This script is for educational and informational purposes only. It does not constitute financial advice or a recommendation to buy or sell any asset. Past performance is not indicative of future results. Always do your own research and consult a licensed financial advisor before making trading decisions. Use at your own risk. Wskaźnik Pine Script®od IndicatorEliteFlow128
Volume Profile Volume Delta OI Delta [Kioseff Trading]Hello! This script serves to distinguish volume delta for any asset and open interest delta for Binance perpetual futures. The image above provides further explanation of functionality and color correspondence. The image above shows the indicator calculating volume at each tick level and displaying the metric. The label color outline (neon effect) is configurable; the image above is absent the feature. The image above shows Open Interest (OI) Delta calculated - similar to how the script calculates volume delta - for a Binance Perpetual Future pair. This feature only works for Binance Futures pairs; the script will not load when trying to calculate OI Delta on other assets. Additionally, a heatmap is displayable should you configure the indicator to calculate it. The image above shows a heatmap using volume delta calculations. The image above shows a heatmap using OI delta calculations. Of course, these calculations - when absent requisite data - require some assumptions to better replicate calculations with access to requisite data. The indicator assumes a 60/40 split when a tick level is traded at and only one metric - "buy volume" or "sell volume" is recorded. This means there shouldn't be any levels recorded where "buy volume" is greater than 0 and "sell volume" equals 0 and vice versa. While this assumption was performed arbitrarily, it may help better replicate volume delta and OI delta calculations seen on other charting platforms. This option is configurable; you can select to have the script not assume a 60/40 split and instead record volume "as is" at the corresponding tick level. The script also divides volume and open interest if a one-minute bar violates multiple tick levels. The volume or open interest generated on the one-minute bar will be divided by the number of tick levels it exceeds. The results are, subsequently, appended to the violated tick levels. Further, the script can be set to recalculate after a user-defined time threshold is exceeded. You can also define the percentage or tick distance between levels. Also, it'd be great if this indicator can nicely replicate volume delta indicators on other charting platforms. If you've any ideas on how price action can be used to better assume volume at the corresponding price area please let me know! Thank you (: Wskaźnik Pine Script®od KioseffTradingZaktualizowano 131131 8.8 K
Volume Profile Visible Range (VPVR) with POC PriceThis script visualizes volume distribution for the bars currently visible on your chart, helping you identify key liquidity zones and high-traffic price levels. Main Features: ・Dynamic Range: Recalculates automatically as you zoom or scroll. ・POC Price Label: Highlights the Point of Control (highest volume) with a clear price tag. ・Value Area (VA): Visually separates the most active trading zone (default 70%). ・Highly Flexible: Choose your preferred layout (Left or Right) and colors. How to use: 1. Spot S/R Levels: Look for long bars (High Volume Nodes); these often act as strong support or resistance. 2. Monitor the POC: The Point of Control is a price magnet. Watch for reactions or retests at this level. 3. Low Volume Gaps: Price tends to move quickly through areas with very short volume bars.Wskaźnik Pine Script®od ken5_5489Zaktualizowano 157
Volume Profile Heatmap/ConcentrationThis is based on Colejustice's indicator. I just improved it so there's more clarity of the highly concentrated levels by making them more saturated and also reducing the noise of low saturated areas. There are also new settings that you can play with, such as: 1. Exponential Intensity Making this higher will increase the saturation of high volume areas and lower the saturation of lower volume areas, basically, it changes the rate at which the saturation increases, so the levels are more visible 2. Visibility Threshold Adjustes how much % of the highest volume areas will be visible. The default is 40%, so it doesn't show so much low-volume noise and gives the indicator more clarity. Wskaźnik Pine Script®od gajdosmarian13Zaktualizowano 26
Volume Profile (Ref Back)This script shows you Volume Value Areas with reference back by n periods.Wskaźnik Pine Script®od p_zerbst29
Volume Profile - POC, VAH, VAL with ExtensionsMarks POC, VAH and VAL over selected time periods and extends the marker into the future for a selected periodWskaźnik Pine Script®od fairway10enterprises2234
Spike Base VPVolume Profile Spike Base: Key Features: Identifies M Period: Detects the 3:30-4:00 PM ET 30-minute candle (highlighted with light blue background) Tracks Pre-M Extremes: Monitors the highest high and lowest low before the M period begins Validates Extensions: Only marks spike bases when the M period extends at least 1 point (configurable) beyond the pre-M extreme Visual Markers: Green line = Bullish spike base (low extension) - the highest low before M period Red line = Bearish spike base (high extension) - the lowest high before M period Lines extend to the right for easy reference Triangle markers show when valid spike bases form Usage Notes: Use on a 30-minute chart for /ES Ensure your chart time zone is set to America/New York (or adjust the time zone) The minimum extension is set to 1.0 points but you can adjust it in the indicator settings Works best when the M period creates a true spike beyond recent price action The indicator will draw horizontal lines at your spike base levels that persist on the chart, making them easy to reference for potential support/resistance during your day trading. (default is 5 days, adjustable from 1-30 days)Wskaźnik Pine Script®od thaddious9
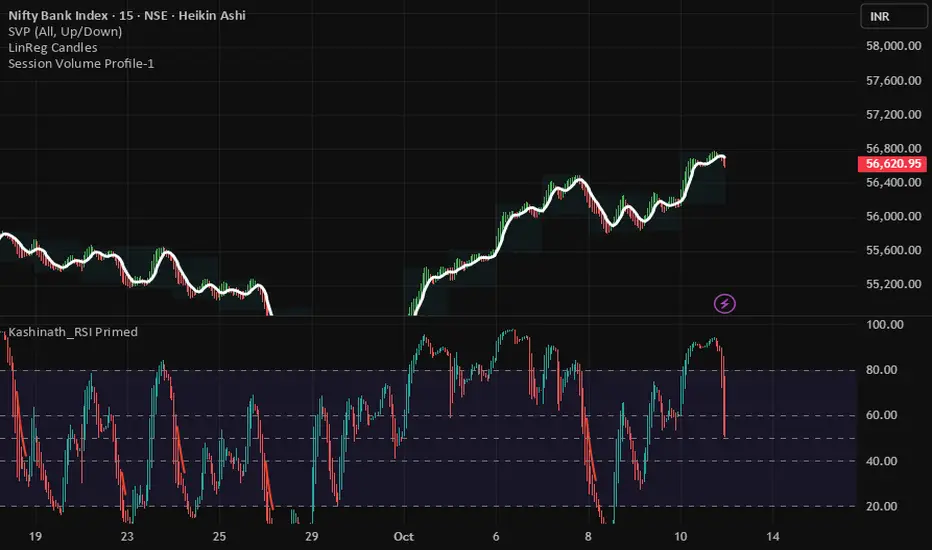
Volume Profile S/R + OB/OS + BreaksAs a support resistance trader I have created this indicator that shows SR lines. RSI over bought and over sold. I also added momentum candle. It's easy to use. The arrows show over bought and over sold, that's where I start to be interested. Confirmation is if we are near a support/resistance area. shown as a red/green line. Don't just trade the RSI, Be patient and only take the perfekt setups. I't clean, it's simple it works. Wskaźnik Pine Script®od ThecantillonreportZaktualizowano 44
Volume Profile - Previous Day Levels The green lines and area represent previous day Value Area. The values are not completely identical to Trading View default levels because of difference in calculation. The white lines represent the min-max prices during the initial balance (9:30 to 10:30 EST). The diagnoal lines cannot be removed unfortunately. You can also see same day evolving Valuea area and POC for momentum analysis. Wskaźnik Pine Script®od ChuckUme2243